Overview
This project showcases full-stack analytics proficiency across two BI platforms, Power BI and Tableau, by using datasets from Kaggle to drive insights in insurance risk and human resources. The project consists of two comprehensive dashboards, each focusing on a particular business domain.
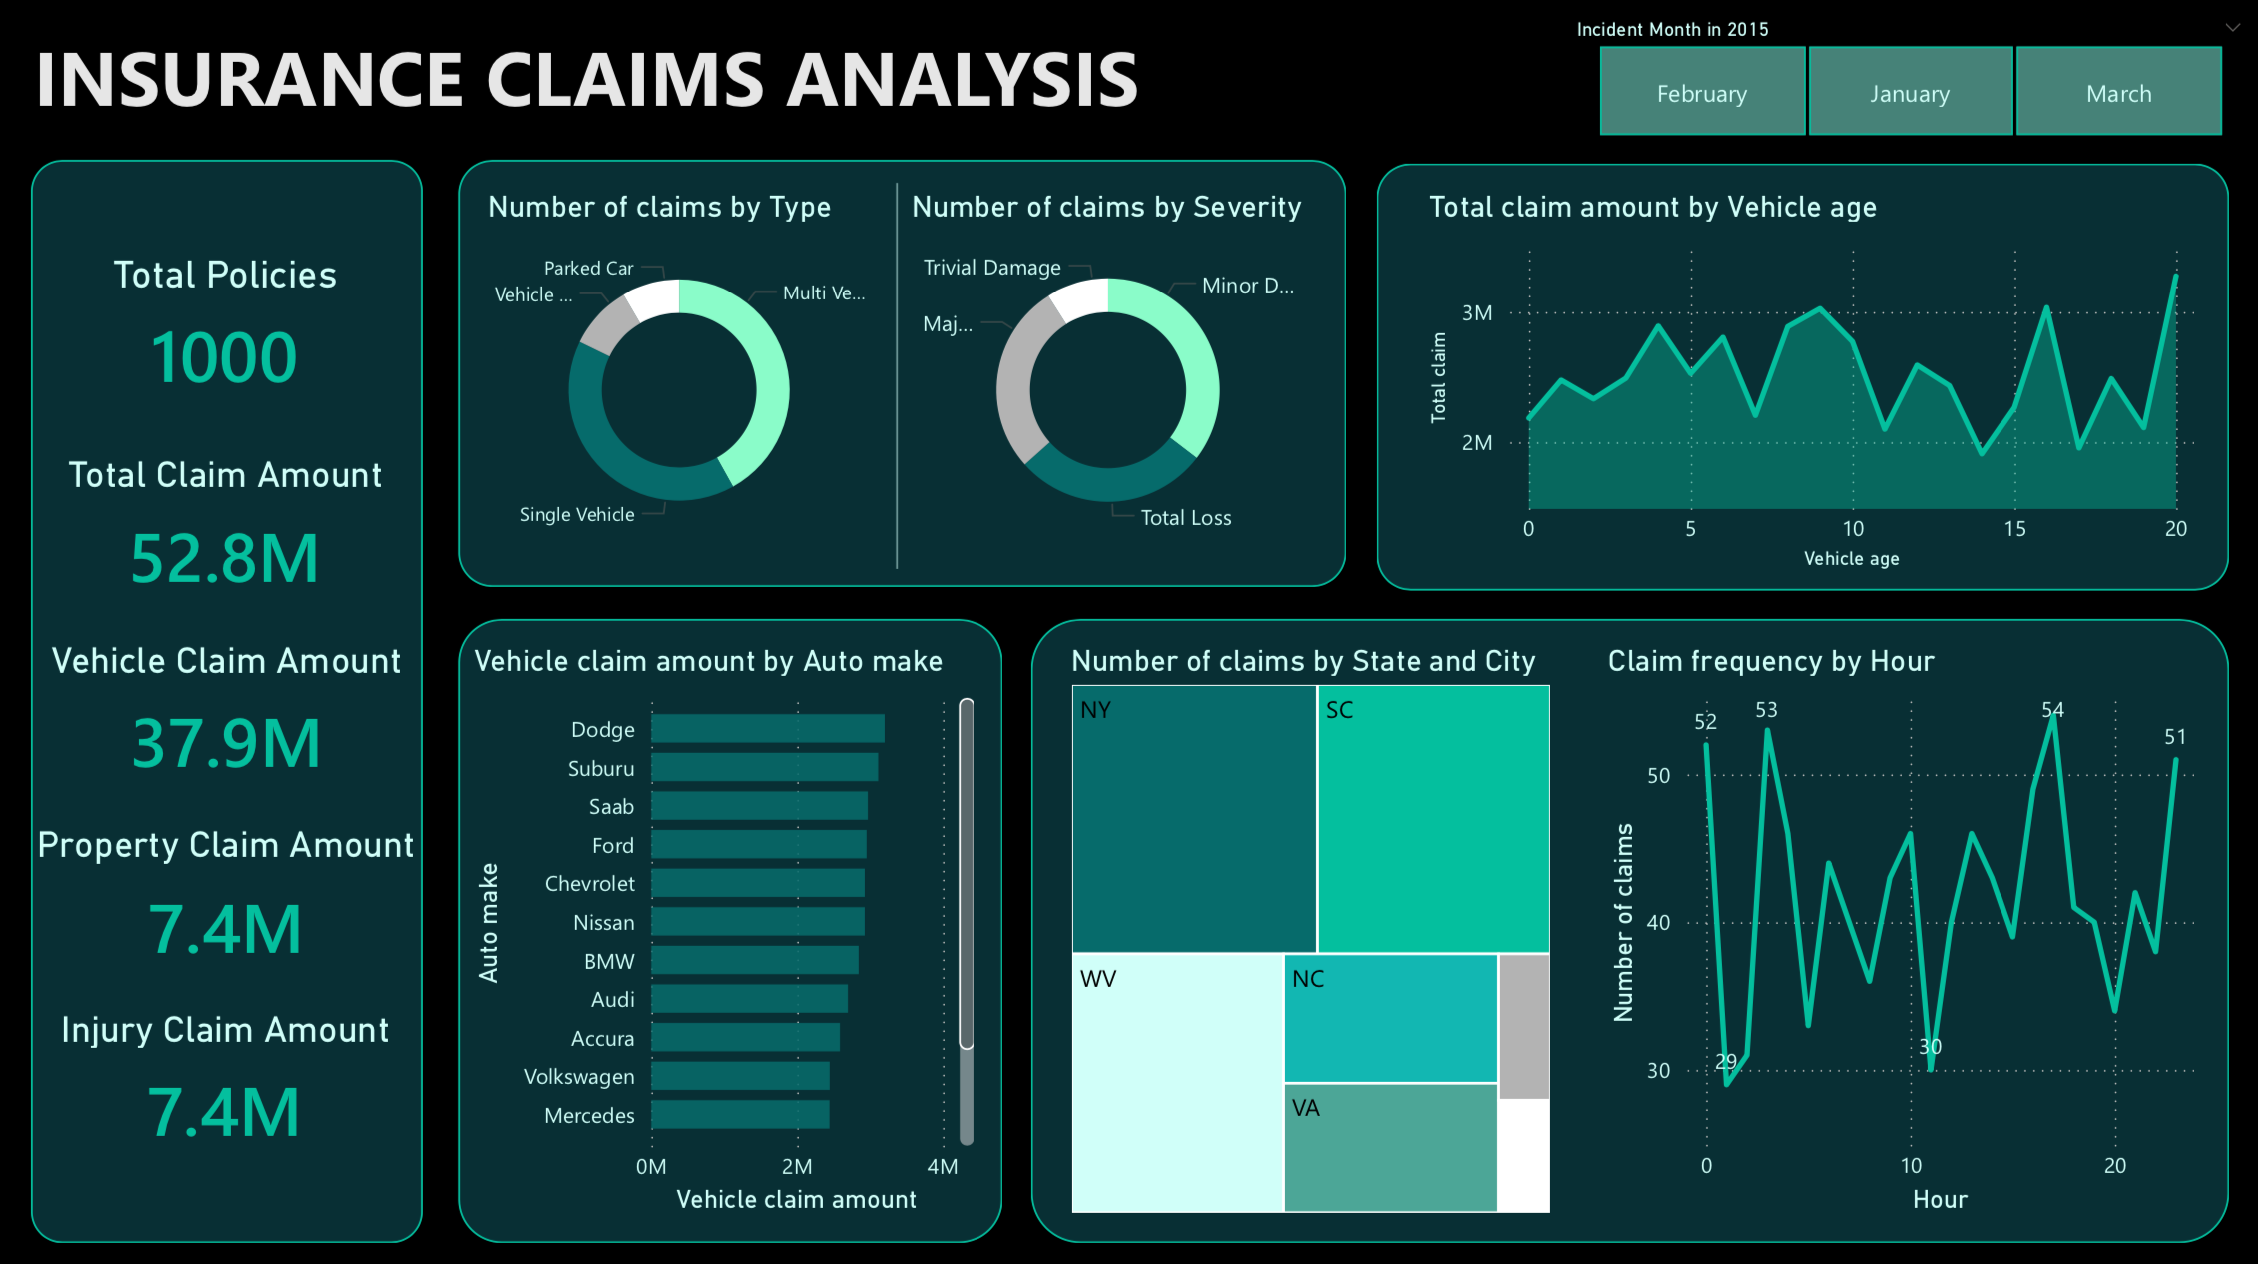
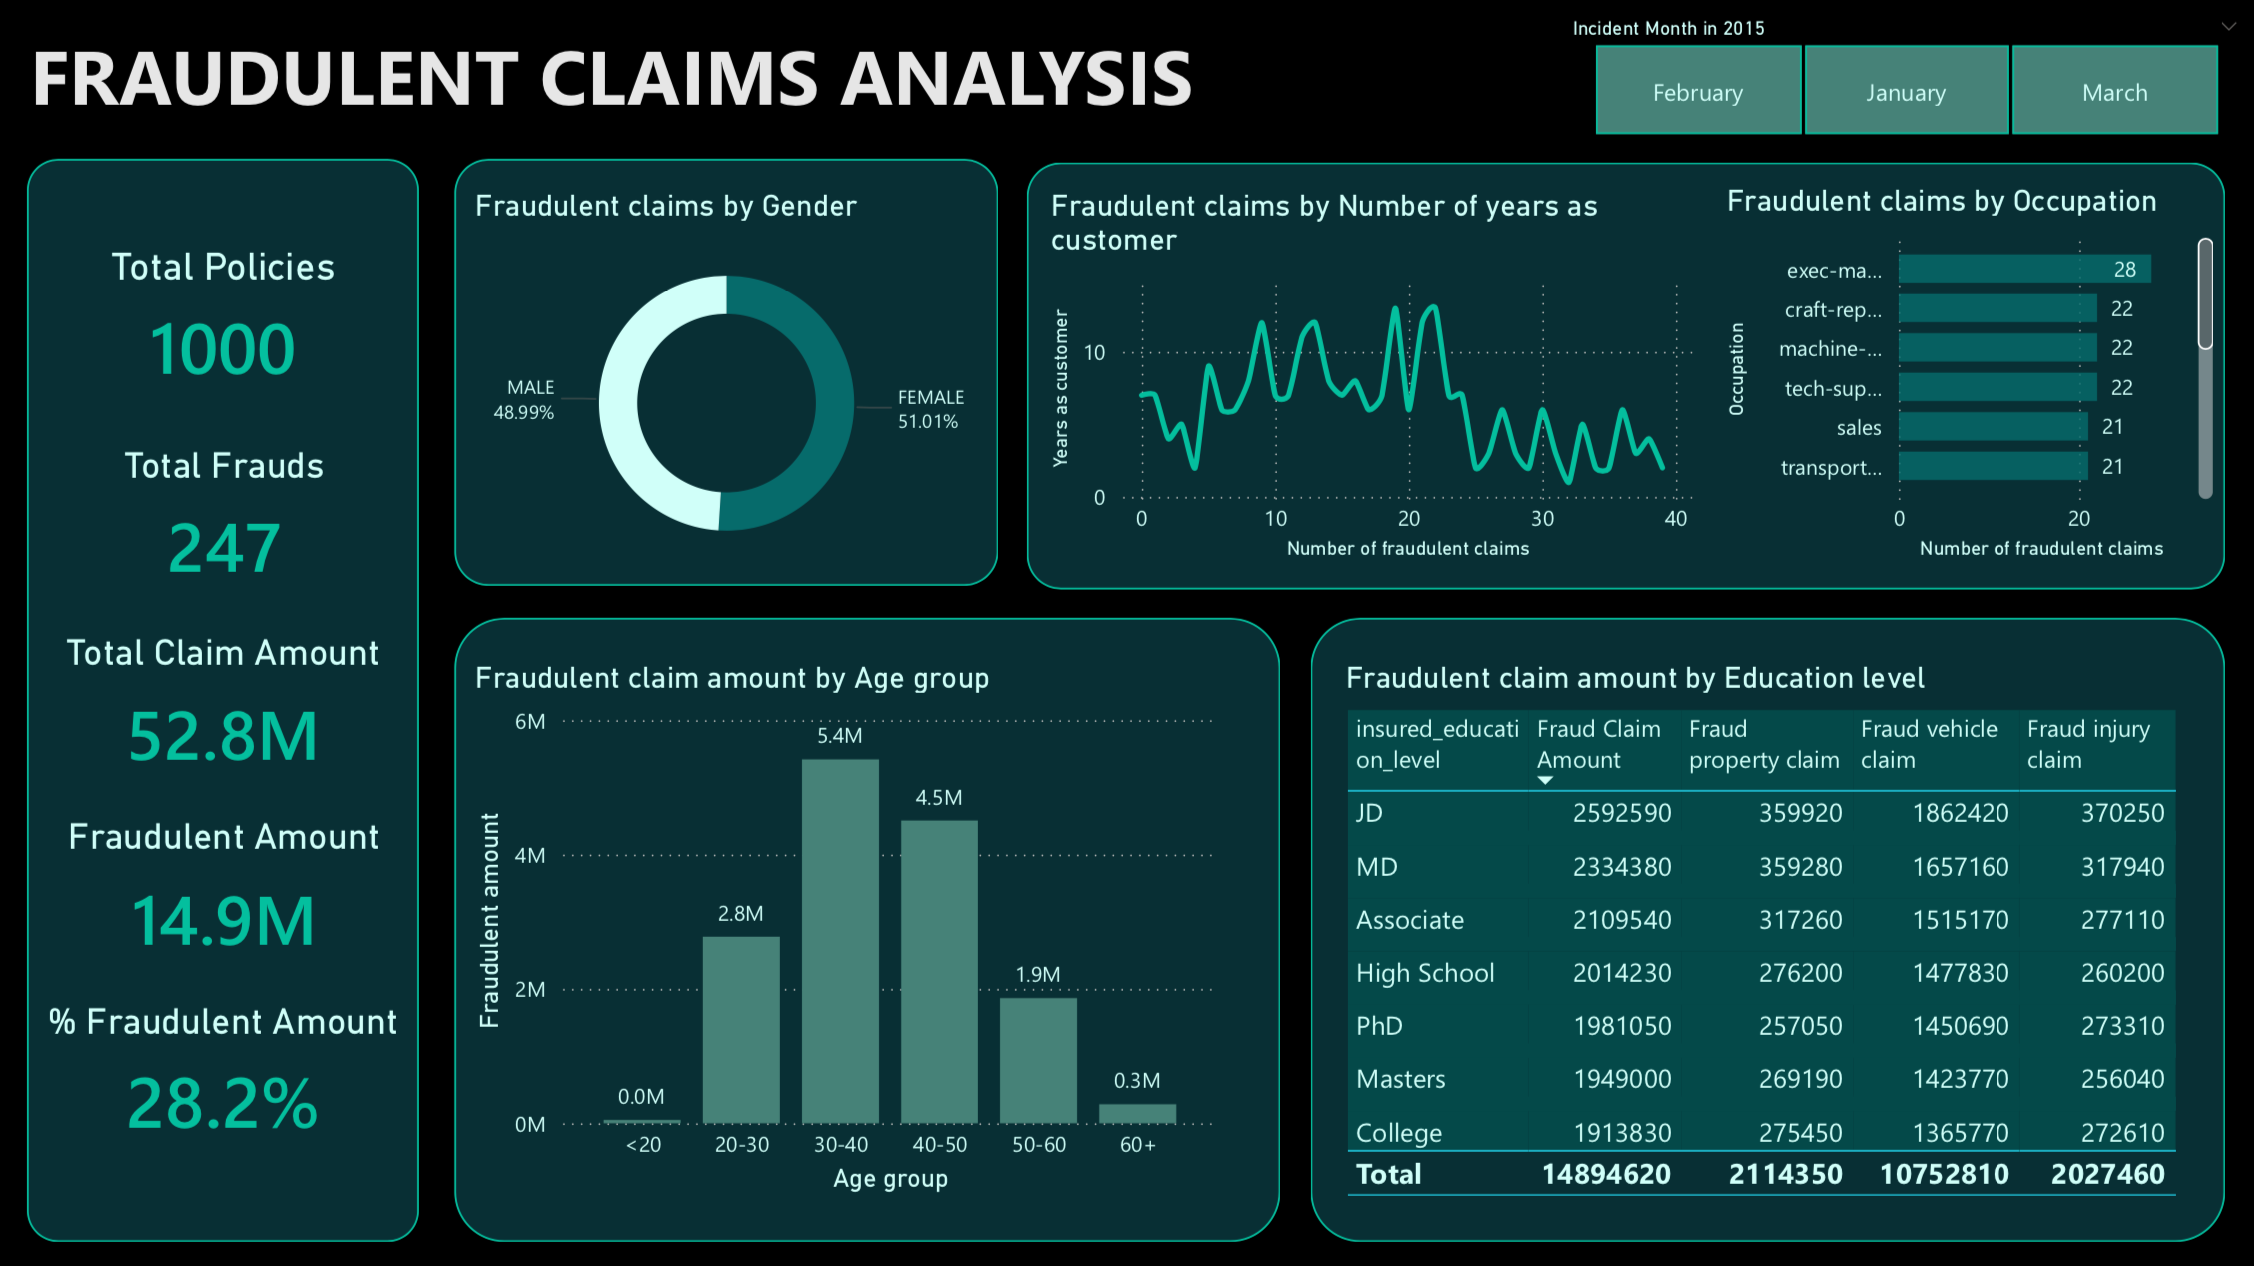
Insurance Data Analysis
The Insurance Data Analysis Power BI project provides valuable insights into insurance claim data, with a focus on fraud detection and understanding claim characteristics. The dataset used for analysis consists of 1000 individual claims, with 40 different attributes that describe each claim, categorized into four main categories: the insured person, their policy details, incident description, and characteristics of the involved car.
Project Goals
1. Use DAX to analyze the frequency and distribution of car insurance claims in the dataset.
2. Identify patterns or factors that may indicate a higher likelihood of insurance claims number.
3. Explore the relationship between different attributes and the likelihood of fraud.
4. Visualize the demographic of insured persons with fraudulent claims.
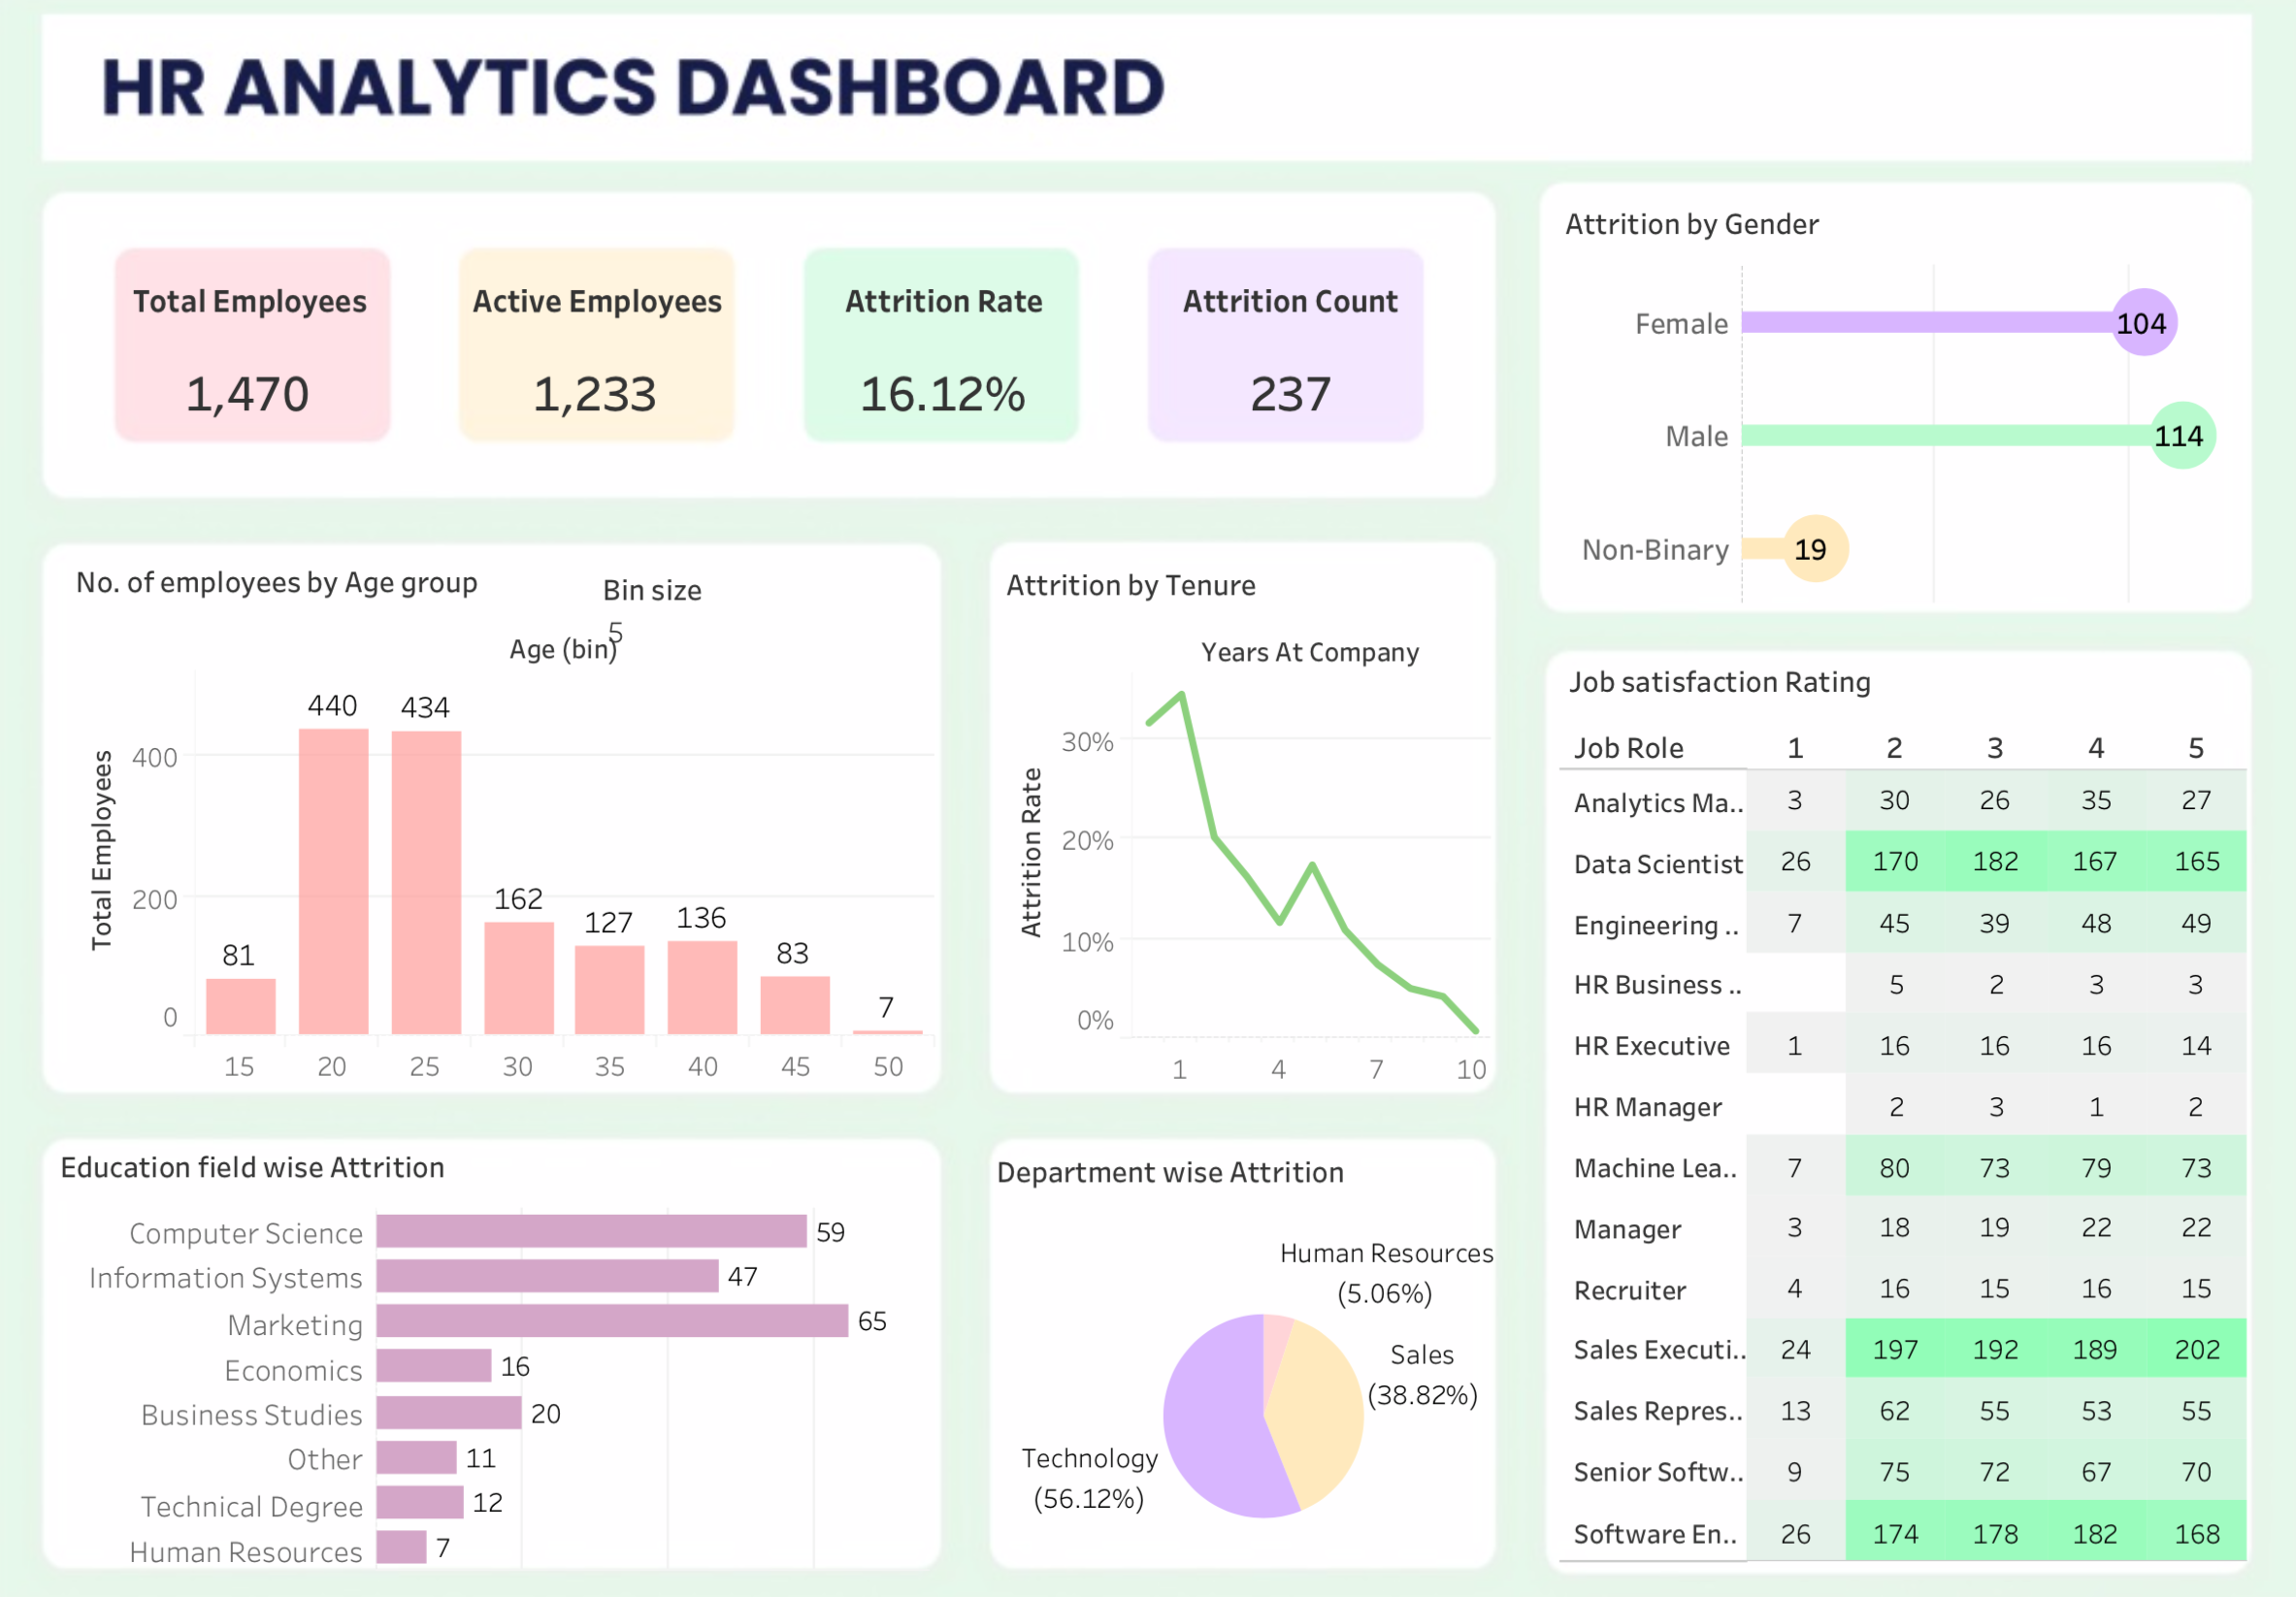
HR Analytics Dashboard
This dashboard provides a comprehensive overview of employee data using fictitious datasets from a Tech company called Atlas Labs. The core goal is to monitor key metrics on employees, and the secondary goal is to understand what factors impact employee attrition.
Dataset Overview
This project utilizes Kimball Model approach, structured around a central fact table and multiple dimension tables. The fact table stores Performance Ratings, which contains information about employees yearly reviews.
The dataset consists of multiple dimension tables: Employee, EducationLevel, RatingLevel, and SatisfiedLevel. Date table is created using DAX.